Visual Hashtable
This assignment lets you visually experience the decreasing performance of a hashtable the more it is filled.
Your
task: build a hashtable, size = 100 elements, and visualize it in the following
way (or similar):
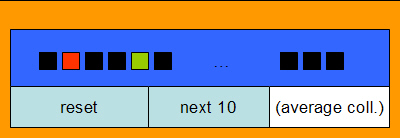
The upper part shows little boxes in black, red and green. This is the
visualization of each cell of your hashtable. The color
of the box corresponds to the number of collisions
that occurred to the element in the cell. The following coloring scheme should
be used:
An empty cell should be black,
·
a cell with an element that didn't
collide at all should be shown in green,
·
a cell containing an element that
collided >=7 times should be red,
·
a cell containing an element that
collided 0<n<7 times should interpolate accordingly between green and
red.
The following code shows how to compute the color , given the numbers of
collisions ("-1" is used for empty cell). "Color" is a class in
jawa.awt.
//-----------------------------------------------------------------------
public Color
computeCellColor(int collisions){
int r =
(int)(255.0/7.0*collisions); //
collisions = 0: r = 0. coll >=7: r>=255.
r =
(int)Math.min(r,255); //
same as: if (r>255) r = 255;
int g = 255-r; //
green value: the 'opposite' of r: if r=255 => g=0 and vice versa.
int b = 0; //
sets blue to zero, only red/green values are displayed
return(new Color(r,g,b));
}
//-----------------------------------------------------------------------
Explanation of the color scheme:
0 collisions will be green, >=7 collision will be red, everything in between
will be between red and green, which is yellowish. The number 7 is chosen
because it's about log(100).
This means that red elements would have performed
better in a balanced binary search tree.
The other elements of the GUI:
·
RESET resets the system (empties
the array).
·
NEXT10 creates 10 random numbers
and puts them into the hashtable.
·
(av. collisions) is a JTextField
showing the average collisions that occurred (=total collisions/number of
elements in table)
Specifications for the hashtable:
·
The random numbers should be in a
range between [0..1000], use v = Math.random()*1000.
·
The hash function is H(v)=round(v).
The index is H(v)%100.
·
For collision handling use linear
probing.
...and of course you can fill a max. of 100 elements into an array of size 100.
GUI: the boxes can either be drawn using custom drawing, or you can just
fill a grid with panels and set the background color. I would do custom drawing
(MUCH more efficient), but that's just me.
What do we expect to see?
Filling in the first 10 elements ("next10" clicked once), all
elements should be green(ish), since not too many collision should occur. With
an increasing number, the filled in elements should become more and more red,
since they collided more often. Btw., once an element is in the hashtable, its
color should NOT be changed. The collision only affects the newly filled in
element!
Hints:
Create two arrays. One contains the values, i.e. is the actual
hashtable. A second array contains the number of collisions. The paintComponent
method iterates through the second array, determining the colors based on its
entries.
That's it!
Due date: best before 11/20 for 10 points, 6 points for the following
week, 0 points afterwards.