ASSIGNMENT #5: Von Koch Snowflake
Score: 10 points
The Von Koch
Snowflake is a nice example how to use recursion to create interesting
graphics. Besides that it and its relatives are the topic of serious research in
math, but for now we are just interested in recursion and beauty.
Results first: Here's your
task. Please write a recursive program that creates this output:
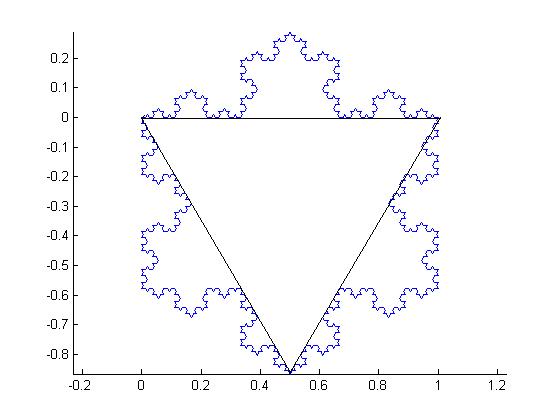
(remark: please visualize the
snowflake only, not the triangle in the middle, and not the coordinate axes
shown in the figure above. I programmed the curve in matlab, that's why the
axes are shown).
The snowflake you see
developed from the triangle in the center by recursively applying a simple rule
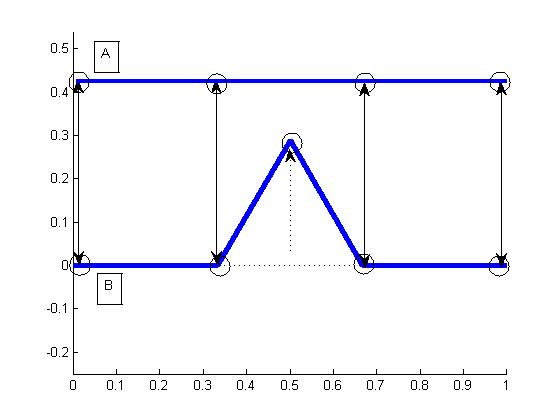
to each of the triangles sides. The Rule, which i deliberately state
iteratively here:
- cut the side (of length l) into 3 equal parts (of length l/3)
- replace the center part with 2 sides of length l/3, such that it forms a
spike
- repeat the process for each
of the 4 sides, until the length of each side is smaller than a given value.
The following figure
visualizes this construction rule.
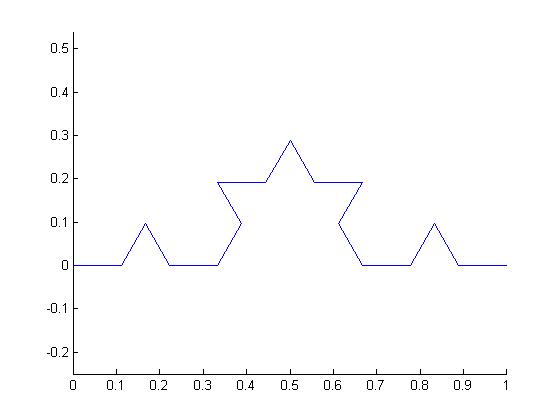
And this is how it looks
after being applied twice...
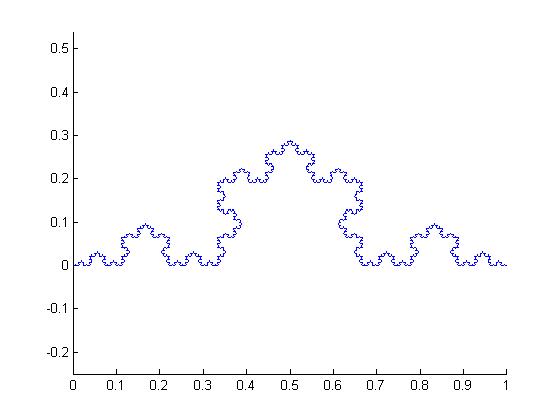
...or applied 7 times:
Finally, if you start with 3
sides (the triangle in figure 1), you'll get the Von Koch Snowflake.
Your task: Compute a von Koch
Snowflake RECURSIVELY and display it. As you can see in the figure above, the
input segment (s,e) is split into four new segments. These segments are: (s,p1), (p1,p3), (p3,p2), (p2,e), we
talked about this in class. You don’t
have to deal with the geometric problem. All you need is to know how to compute
the new points p1,p2,p3 to create the new segments. Please look at the computation of points and even the basic
structure of the recursion in THIS TEXTFILE.
Recursion:
The stop case should test, if
the line segment is shorter than a given threshold (e.g. shorter than 1). The
length of a line segment with endpoints s=(xs,ys) and e=(xe,ye) is sqrt((xe-xs)^2+(ye-ys)^2). If the stop
criterion is met, the segment’s endpoints should be stored in a list
(Java LinkedList), followed by return().
This list will therefore
contain all segments of the curve after the recursive computation has finished;
it can then be displayed (custom graphics).
Your recursive function will look
like (pseudocode, a more detailed version is in the textfile, see above):
-----
function Koch(s, e)
if length(s-e)<1
store
s, e in list
return
else
compute
points s,p1,p3,p2,e representing
the updated segment
Koch(s,p1)
Koch(p1,p3)
Koch(p3,p2)
Koch(p2,e)
Return
end
Good luck!