ASSIGNMENT #5: Von Koch Snowflake
Score: 10 points
The Von Koch
Snowflake is a nice example how to use recursion to create interesting
graphics. Besides that it and its relatives are the topic of serious research
in math, but for now we are just interested in recursion and beauty.
Results
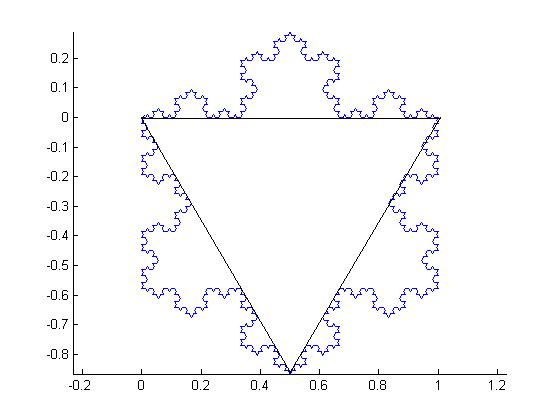
first: Here's your task. Please write a recursive program that creates this output:
(remark:
please visualize the snowflake only, not the triangle in the middle, and not
the coordinate axes shown in the figure above. I programmed the curve in matlab, that's why the axes are shown).
The snowflake you see
developed from the triangle in the center by recursively applying a simple rule
to each of the triangles sides. The Rule, which i
deliberately state iteratively here:
- cut the side (of length l) into 3 equal parts (of length l/3)
- replace the center part with 2 sides of length l/3, such that it forms a
spike
- repeat the process for each
of the 4 sides, until the length of each side is smaller than a given value.
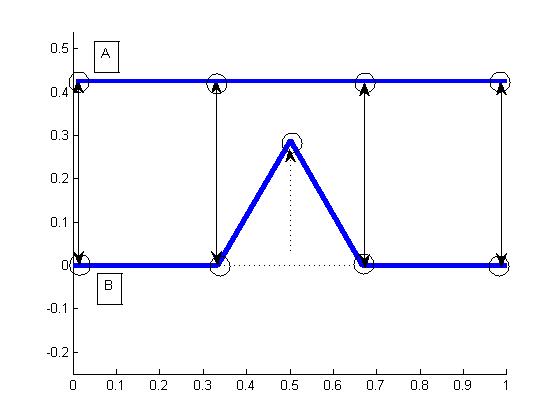
The following figure
visualizes this construction rule.
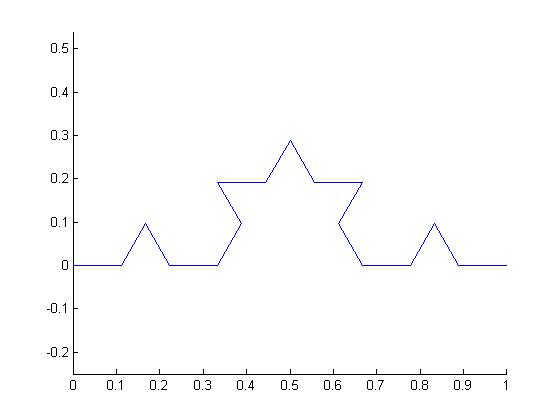
And this is how it looks
after being applied twice...
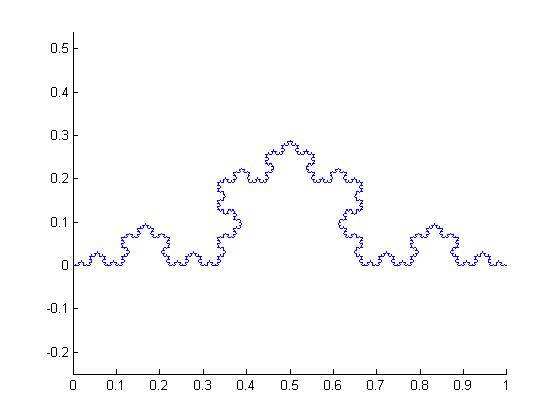
...or applied 7 times:
Finally, if
you start with 3 sides (the triangle in figure 1), you'll get the Von Koch
Snowflake.
Your task: Compute a von Koch
Snowflake RECURSIVELY and display it. In the lab, Pauline will give help on the
geometry. A useful geometric hint: the height of the spike is l/sqrt(12),
i.e. if you would start with a line defined by the end points [0 0], [1 0], a single application of the construction rule
would lead to line segments defined by the following 5 points: [0 0], [1/3 0], [0.5 1/sqrt(12)], [2/3 0], [1 0].
Recursion:
The stop case should test, if
the line segment is shorter than a given threshold (e.g. shorter than 1). The
length of a line segment with endpoints p1=(x1,y1) and
p2=(x2,y2) is sqrt((x2-x1)^2+(y2-y1)^2).
If the stop criterion is met, the segment’s endpoints should be stored in
a list (Java LinkedList), followed by return().
This list will therefore
contain all segments of the curve after the recursive computation has finished;
it can then be displayed (custom graphics).
Your recursive function will
therefore look like (pseudocode):
-----
function Koch(startpoint,
endpoint)
if length(startpoint-endpoint)<1
store startpoint, endpoint in list
return
else
compute 5 points p1..p5
representing the updated segment
Koch(p1,p2)
Koch(p2,p3)
Koch(p3,p4)
Koch(p4,p5)
end
Good luck!